See exactly what you would be looking at.

Screens from the software we ship. The farm hand opens Today and taps jobs. The box still records moisture, temperature and salts underneath. What each picture proves, and what it does not, is written underneath it.

This farm is not real. The software is.

Every field and every probe in these pictures is labelled SIMULATED, in the data itself, so the label survives a screenshot. Inventing soil to show the software is fair. Letting you think the soil is real is not. The first real probes go in with the Phase 1 kit. Until then, book a walkthrough if you want someone to click through it with you.

Book a walkthrough
Every field, driest firstcaptured 18 August 2026
Table of three probes. Tomato block north, Probe 1 north ridge: DRY, consider irrigation, 21.6 percent moisture, 23.2 degrees, 522 microsiemens, 60 percent battery, good signal, 8 minutes ago. Tomato block north, Probe 2 north gate: OK, 30.7 percent, 23.8 degrees, 523 microsiemens, 37 percent battery, fair signal, 8 minutes ago. Pepper block riverside, Probe 3: NO SIGNAL, reading is stale, 42.3 percent, 30.3 degrees, 517 microsiemens, 3 percent battery, weak signal, last heard 5 hours ago.
The screen the manager opens in the morning. Fields keep the names your farm already uses. The driest row sits at the top. DRY means water that ridge today. OK means leave it. NO SIGNAL means the last number is old. Do not pump from it. Walk that plot and check the probe. The riverside row was last heard five hours earlier, so it is dropped from the field average. A confident stale number is more dangerous than an admitted gap.
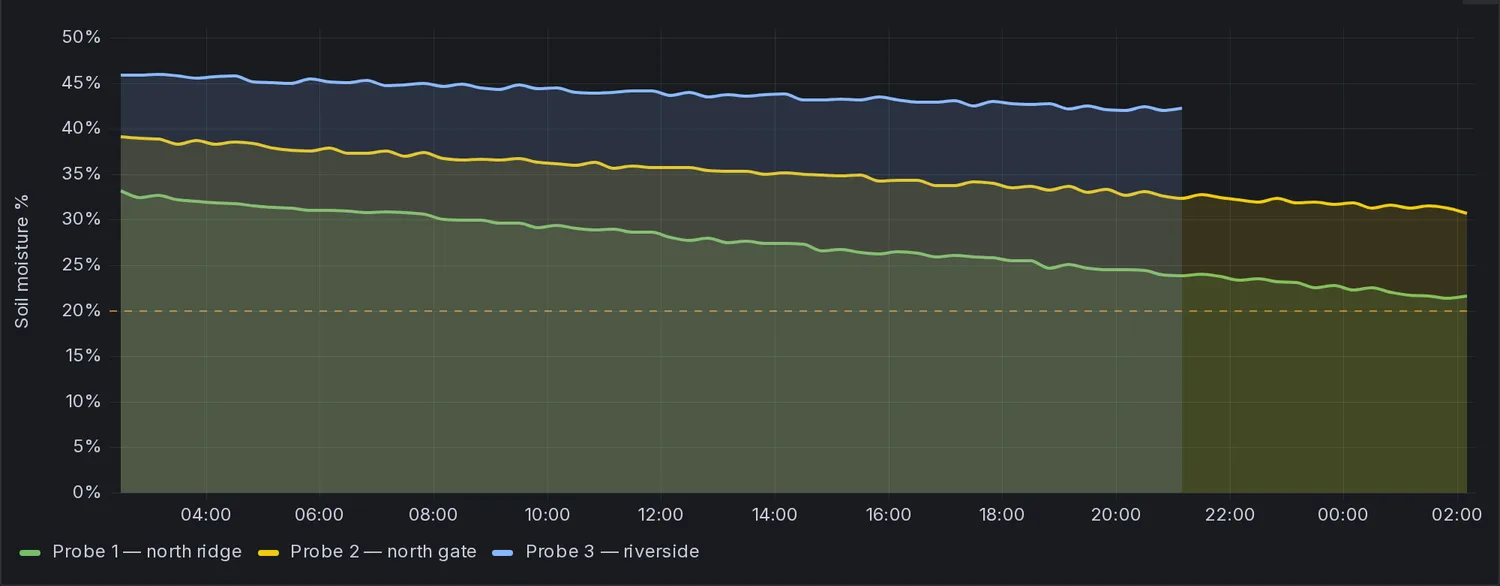
Soil moisture, last 24 hourscaptured 18 August 2026
Line chart of soil moisture over 24 hours for three probes. North ridge falls from about 33 percent to 21.6 percent. North gate falls from about 39 percent to 30.7 percent. Riverside starts near 46 percent and the line stops in the evening, while the other two keep drawing.
The same day, drawn out. You can watch the north ridge dry while the gate holds. The riverside line does not go flat and pretend to be a reading. It stops. That is a probe that went quiet, shown as an absence.
On the phone: Todaycaptured 26 August 2026
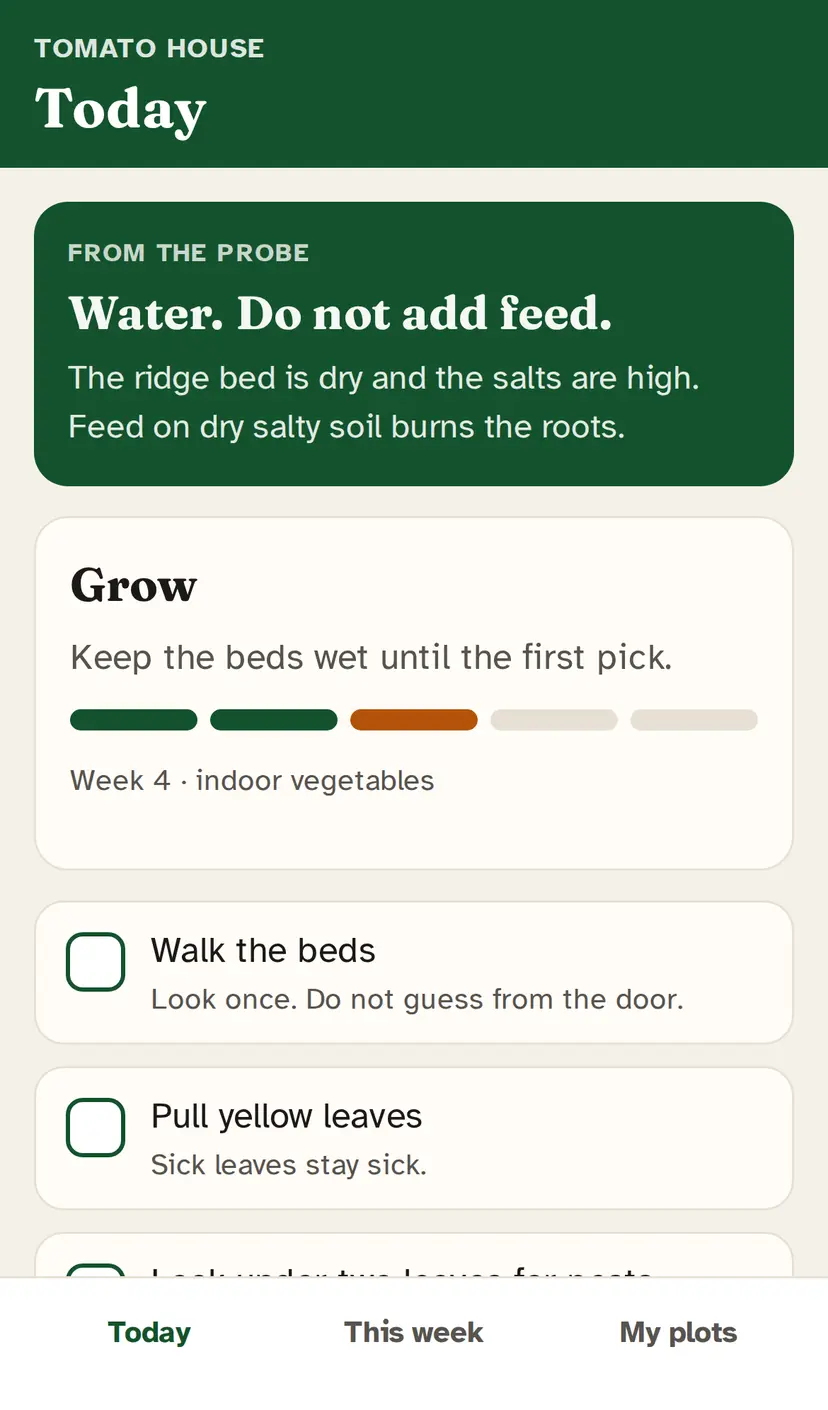
iPhone Field app, Today. Tomato house. Green card from the probe: Water. Do not add feed. The ridge bed is dry and the salts are high. Stage Grow, week 4, indoor vegetables. Tap list: Walk the beds, Pull yellow leaves. No percentages on this screen. Simulated farm.
This is the farm hand's morning. One plot. The stage in words. A tap list. The green card is not a moisture percentage: the probe saw dry soil and high salts together, so the app says Water. Do not add feed. Feed on dry salty soil burns the roots. A cheap moisture stick cannot say that. The farm in the picture is simulated. The software is the one that ships.
This weekcaptured 26 August 2026
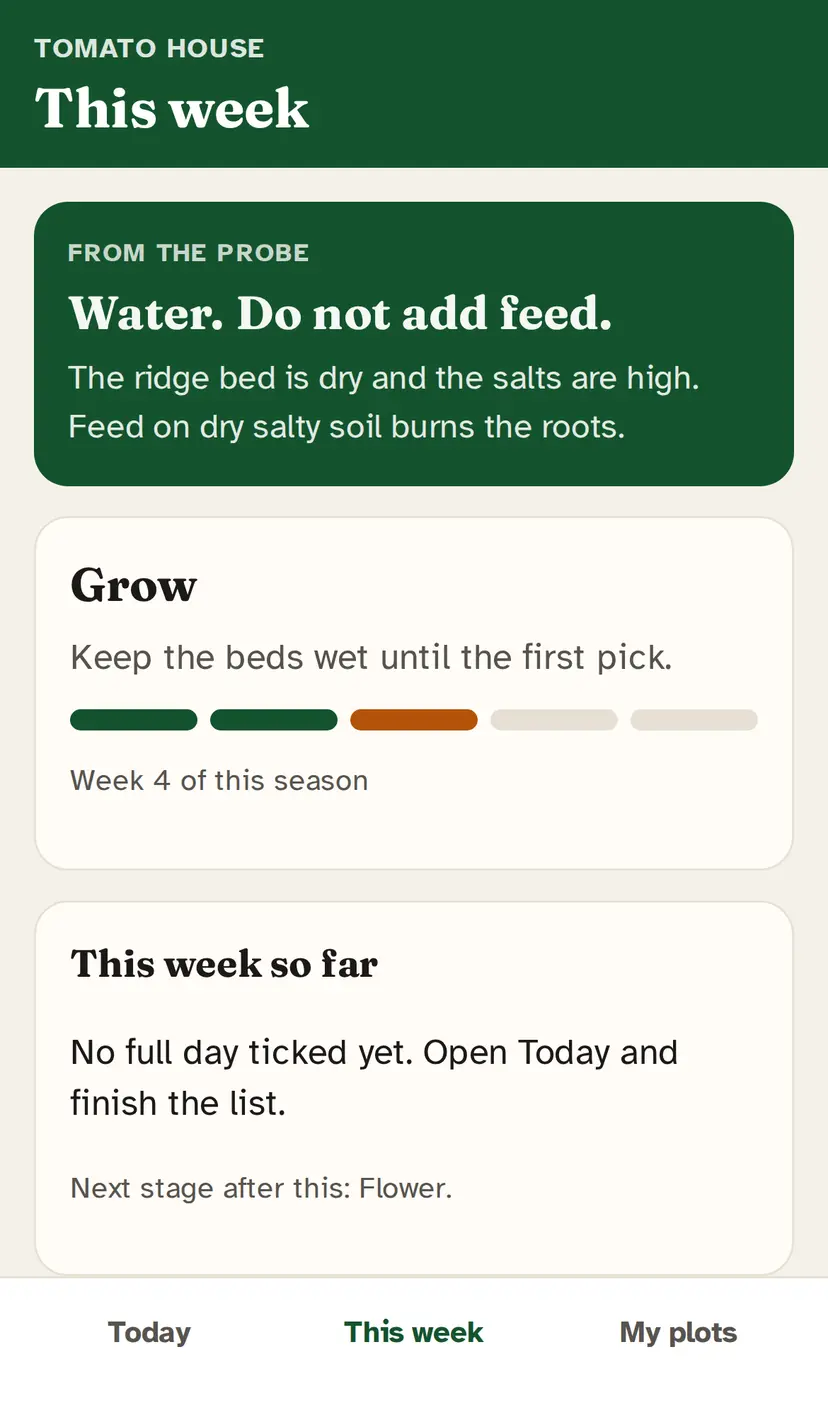
iPhone Field app, This week. Tomato house. Same probe insight. Stage Grow, week 4 of the season. Next stage after this: Flower. Simulated farm.
The goal for the week, the stage of the season, and what comes next. Not a harvest percentage. Tomato house is in Grow. After this comes Flower.
My plotscaptured 26 August 2026
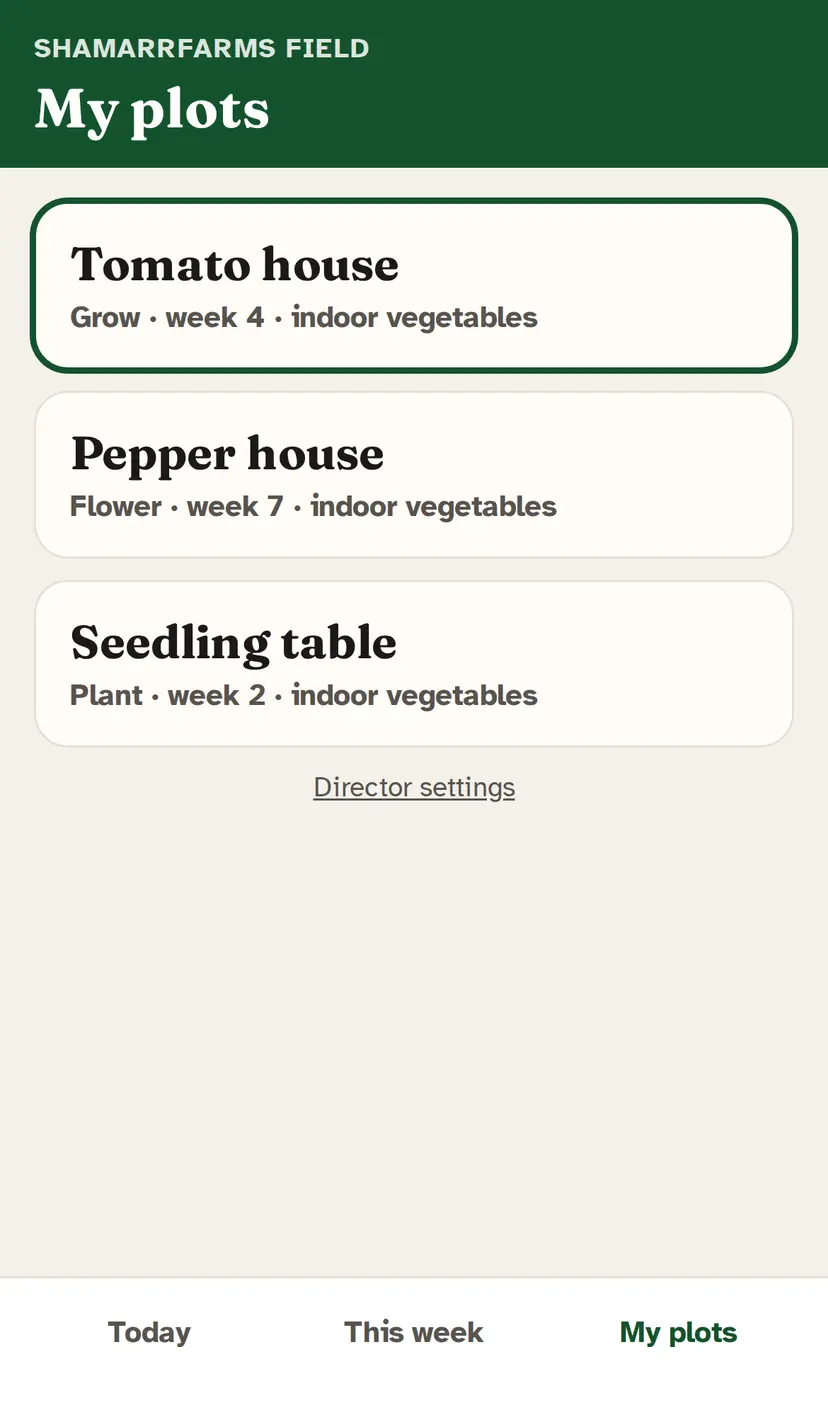
iPhone Field app, My plots. Tomato house, Grow, week 4. Pepper house, Flower, week 7. Seedling table, Plant, week 2. Each is its own farming system. Simulated farm.
Each house is its own system. Tomato is growing. Pepper is flowering. The seedling table is planting. They do not share a checklist. Yam and sesame will be added the same way, later.
Director: names and linescaptured 26 August 2026
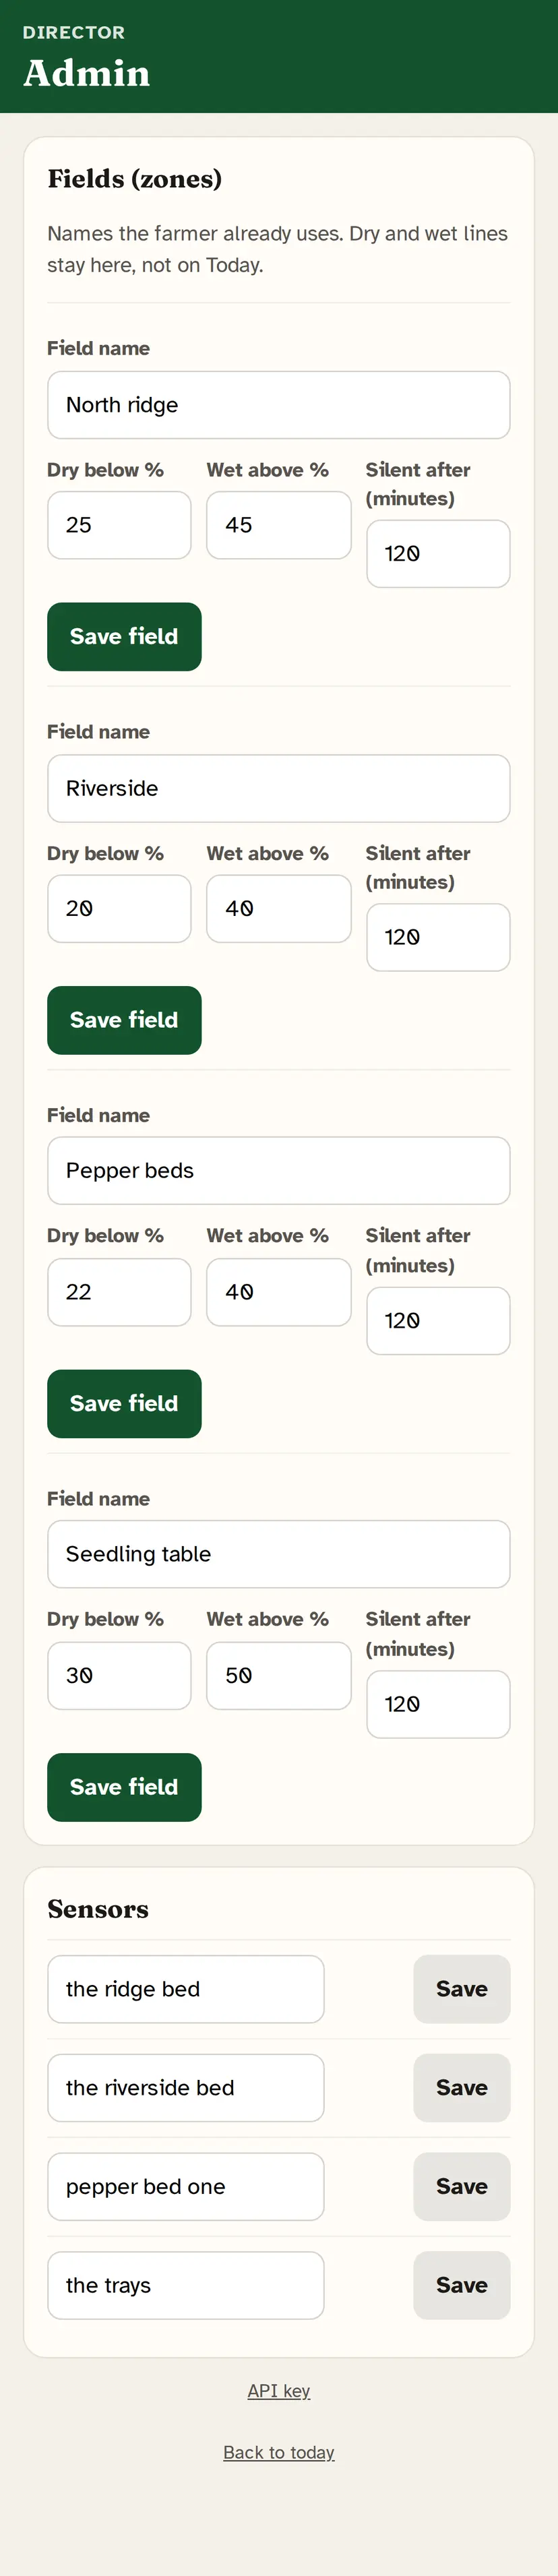
iPhone Field app, Admin. Field names North ridge, Riverside, Pepper beds, Seedling table, each with dry and wet lines. Sensor names the farmer already uses. This screen is for the director, not the morning tap list. Simulated farm.
The farmer does not live here. You name the beds the way the farm already talks. Dry and wet lines stay on this page. Today never shows those numbers.
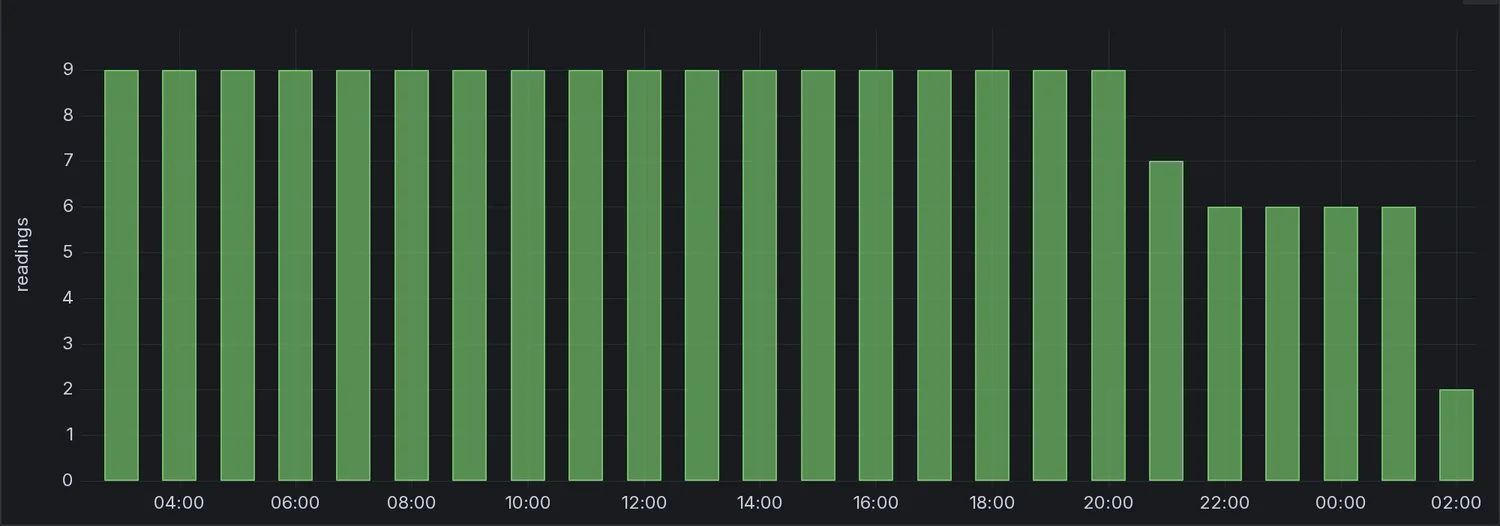
Readings received per hourcaptured 18 August 2026
Bar chart of readings received per hour. Nine readings an hour through the day, then a drop to six after the riverside probe stops, and fewer still near the end of the window.
How we know the box itself is healthy, not just the soil. Three probes speaking three times an hour is nine readings. The drop to six is the riverside probe going quiet. The count is how a silent sensor gets noticed the same day, not at harvest.
Where these pictures come from. The field table, moisture chart and intake chart were captured 18 August 2026 from the box. The phone screens (Today, This week, My plots, Admin) were captured 26 August 2026 on an iPhone-sized Safari view of the Field app we ship. Not a designer's impression. The farm in every picture is simulated. No probe is in the ground yet. The first field probes go in with the Phase 1 kit, and these captures get replaced with field ones the week they land.

What is proven, and what is not

Stated in the same terms we would accept from a supplier.

PROVEN

The data path, end to end

Sensor uplink through gateway, ingestion, storage, dashboard and phone view, running on the target hardware, with nine of nine minimum-spec conformance checks passed.

PROVEN

Survives bad connectivity

Ten of ten outage-replay tests passed: when the link drops, readings queue on site and replay in order once it returns. We also shove the whole backlog back in one burst, because a queue breaks on the way back in, not on the way out. Two hundred readings, none dropped.

NOT YET PROVEN

A full season in the field

Every reading so far is a simulated uplink. No probe has been in Nigerian soil through a season yet, so probe accuracy under real heat and real ground is unmeasured. The Phase 1 kit is what settles it, and those results get published the same way as these.

NOT YET PROVEN

Yield impact figures

We do not quote a yield percentage. Nobody can honestly attribute one before several instrumented seasons exist on your own fields.